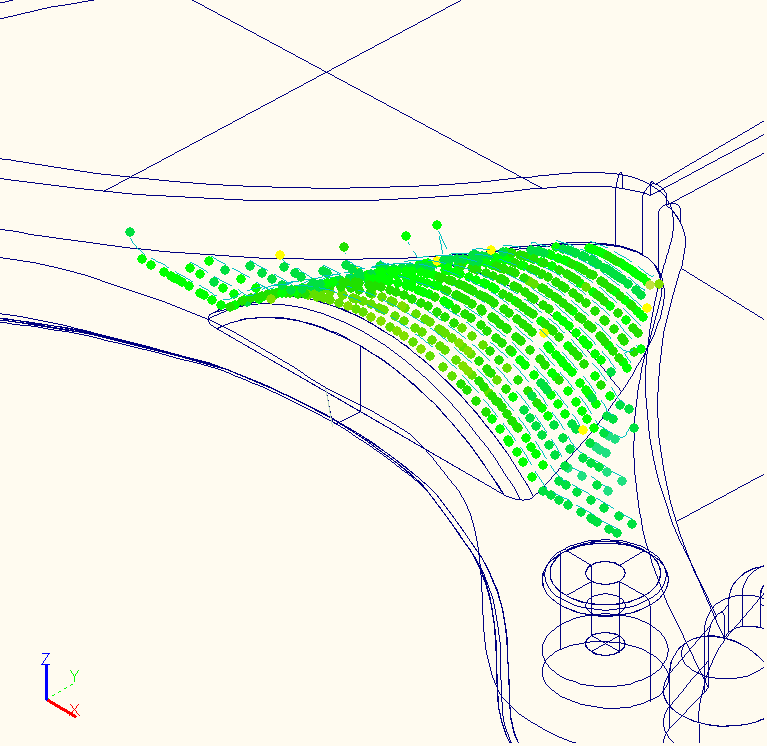
PWI000051
this document applies to :
This is the PowerINSPECT demonstration given at the July 2000 Technical Sales Partner Meeting.
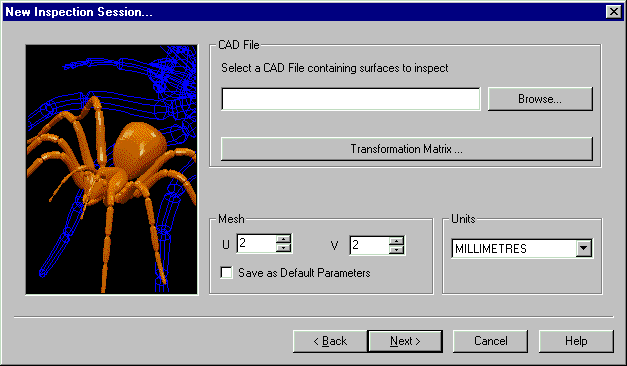
File- New allows you to create a new inspection session. The dialog box below will be displayed.

Getting the CAD: Choose the CAD from the Browser. The ODX format is the format used by PowerINSPECT. An ODX file contains only the data required for inspection. PowerINSPECT uses an ODX file if one is available- if not, it will create an ODX file by extracting the relevant data from an IGS file.

You can browse ![]() for the CAD according to
normal Windows practice, and this will show you a list of available CAD
files. Navigate through them and pick the file you want.
for the CAD according to
normal Windows practice, and this will show you a list of available CAD
files. Navigate through them and pick the file you want.
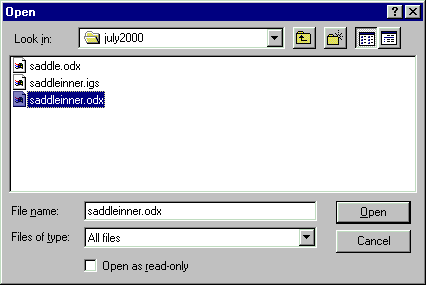
For this demonstration we are using a file called saddleinner.odx.
You can transform the CAD (rotation, translation etc) if required- for example if the
CAD has been produced in die-line but you want to produce an inspection report in
car-line. Do this by clicking on the Transformation Matrix button. ![]()
Build up the transformation as necessary.
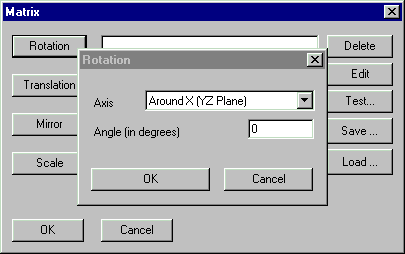
and then choose OK. In this example we have not used the transformation matrix.
Go to the next page of the Wizard using the Next button ![]() at the bottom of the main form.
at the bottom of the main form.
This next page is concerned with Offsets and Tolerances.
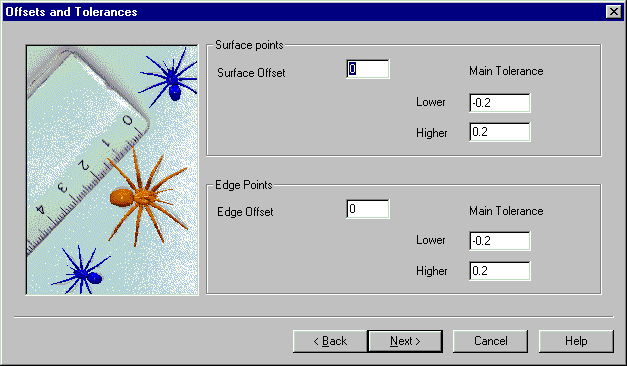
Surface or Edge points may be offset using this form: the working tolerance for the job can be entered by using the Main Tolerance facility (right mouse click) to change the tolerance band. You may set different tolerances for individual inspection groups within the session, but this defines the default settings.
Click on the Next button again to go to the next page of the Wizard. Note that
you can also go backwards to the previous page using the Back button.![]()
The Next page is the Variables form. This contains the link to the chosen Excel template and the variables specific to this inspection session.
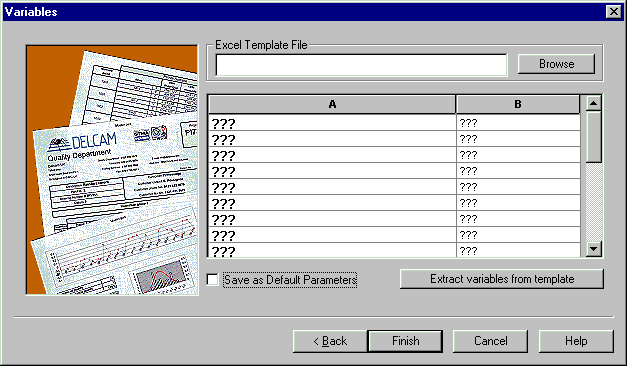
The first thing to do is choose the Excel Template file.
![]()
There is a templates directory associated with each version of PowerINSPECT. This contains a number of standard templates for producing reports. Normally each customer will receive a modified version of one or more of these templates to include the company logo and other customer-specific details.
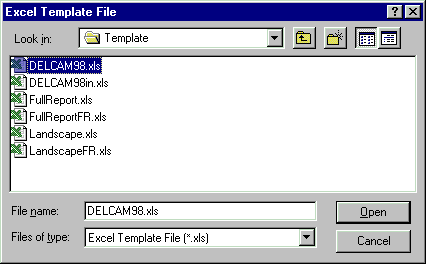
The full path of the template directory is shown in the Internet Explorer window below. This is how the template directory is installed by default.

The template has default variables associated with it. You can import these
variables into PowerINSPECT using the Extract variables from template button. ![]() . Then you can modify the default settings as required.
. Then you can modify the default settings as required.
This starts Excel.
The PowerINSPECT reporting is written using macros. Due to security concerns about macros, which can carry viruses, Excel normally asks whether you want to enable macros or not. You must enable the macros in the PowerINSPECT templates to allow the reports to run.
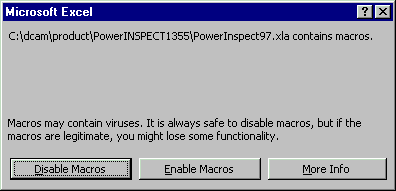
When you complete this operation, the details from the template will be stored as part of the PowerINSPECT session. You can then edit these default values as required.
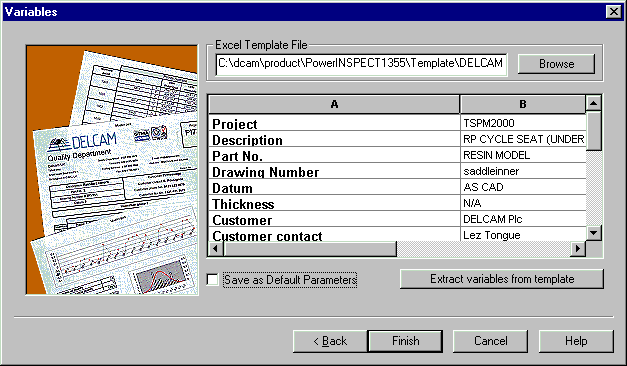
You can also choose to save these values as the default values for a new PowerINSPECT inspection, regardless of template chosen. Do this by ticking 'Save as Default Parameters.'
When you click on Finish a new PowerINSPECT inspection session will open.
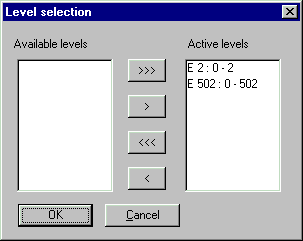
You can change the contents of the view using Display-Visible Levels as shown below.
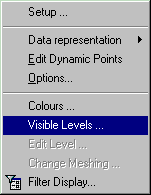
This allows you to make different CAD levels visible or invisible. The Active levels at the right are visible, while the Available levels on the left are invisible. You can move levels from one side to the other using the buttons in the centre.
The triple arrow buttons ![]() transfer all of the
levels in the direction indicated, while the single arrow buttons
transfer all of the
levels in the direction indicated, while the single arrow buttons ![]() transfer only the
selected levels.
transfer only the
selected levels.
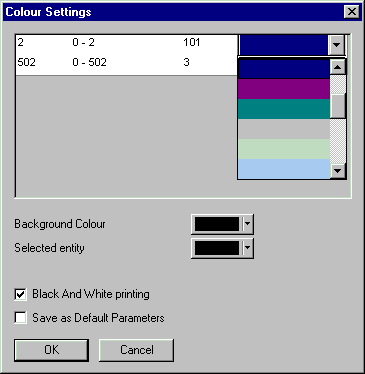
You can change the colours of the display using Display- Colours. This is useful if the original colours do not have enough contrast for easy viewing.
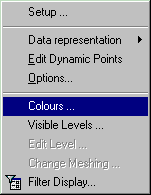
Change the colours of the CAD levels by clicking in the coloured area- this will produce a drop-down menu of colour choices. For the purposes of screen shots for this demonstration, the background colour was changed.
Similarly you can remove selected CAD levels from the inspection, using Measures- CAD Levels for Inspection. Transfer them between active and available using the arrows as before.
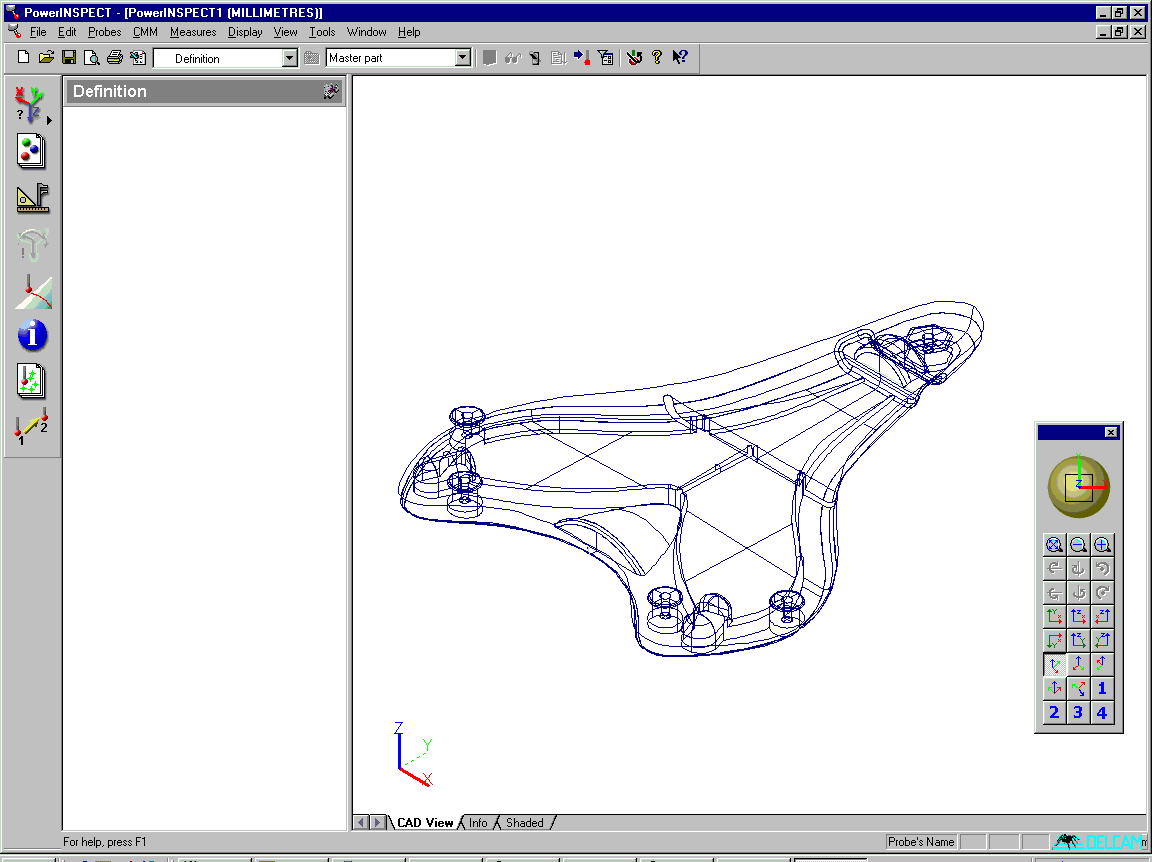
This is the new Inspection session. The CAD data is shown here in Isometric View 1.
First we must create an alignment. This will allow us to relate the CAD data to physical part for inspection. We will create an alignment by measuring a number of geometric features, and then set CAD coordinates for them.
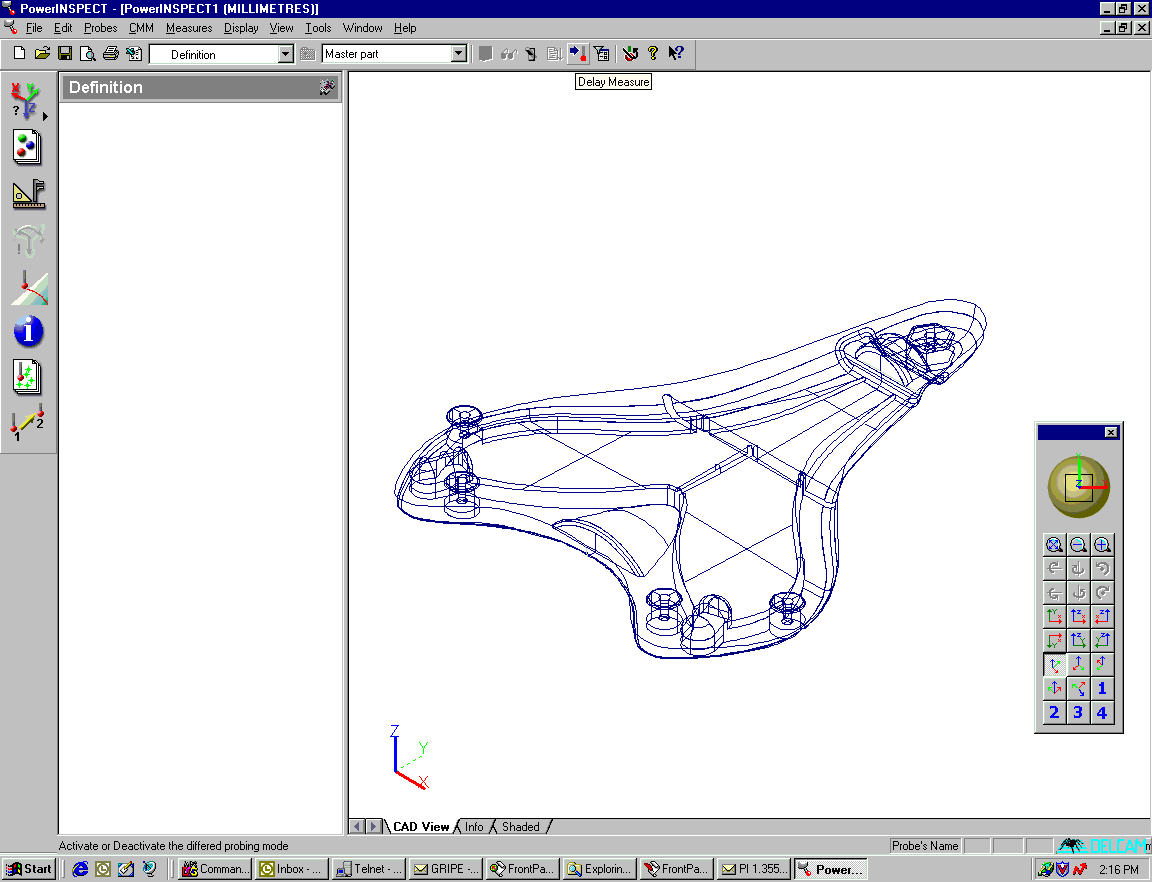
Click 'Delay Measure' in the top toolbar ![]()
so that you can set up inspection elements without measuring them straight away.
The preparation sequence that follows will allow a Best-Fit Positioning from 3 (or more) holes which was introduced in V1.200 but has been enhanced slightly. The CAD part lends itself to this type of set-up as it is free-form (no fixturing being used) but has Geometrical entities that may be used to give a far more accurate positioning than the normal free-form fit.
Use the 'Geometric Group' button on the left hand toolbar to create a geometric group. This will contain measured geometric features, such as planes and circles, which will be used to create the alignment.

This will bring up the Geometric Group Dialog box. Note that you can change the name of the Geometric Group if required. A relevant name may help you to identify the particular group in the sequence tree. You can also decide whether you want this group to be included in the Excel Inspection report- you can now remove or include entire sections at the touch of a button.
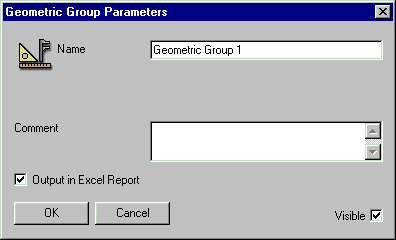
This will create a geometric group as shown below.
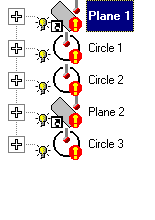
This is the Preparation Sequence : - First a PLANE is probed (this plane is associated with Circle 1 & Circle 2 and is called PLANE 1) CIRCLE 1 & CIRCLE 2 are then measured (ensuring an association with PLANE 1) PLANE 2 is probed next (this plane is associated with CIRCLE 3) CIRCLE 3 is measured next (ensuring an association with PLANE 2) The example shown is using a CMM (Coordinate Measuring Machine) which is equipped with a touch-trigger probe.
If you are using a rigid probe- usually on an Articulated Arm such as Romer, CimCore, Axila, Faro, MicroScribe etc- then the Single Point Circle can be used to replace the Circle feature giving the user the ability to take a single point to construct the circle (providing the Probe Stylus Diameter is larger than the Circle (Hole) being measured.) Be aware that when using this function for this type of positioning the user must use the Point 1::Centre, Point2::Centre, etc and DO NOT USE :- Point 1::ProbeCentre etc.
For more details about the Single Point Circle geometric element, see the technical note, PWI000052.
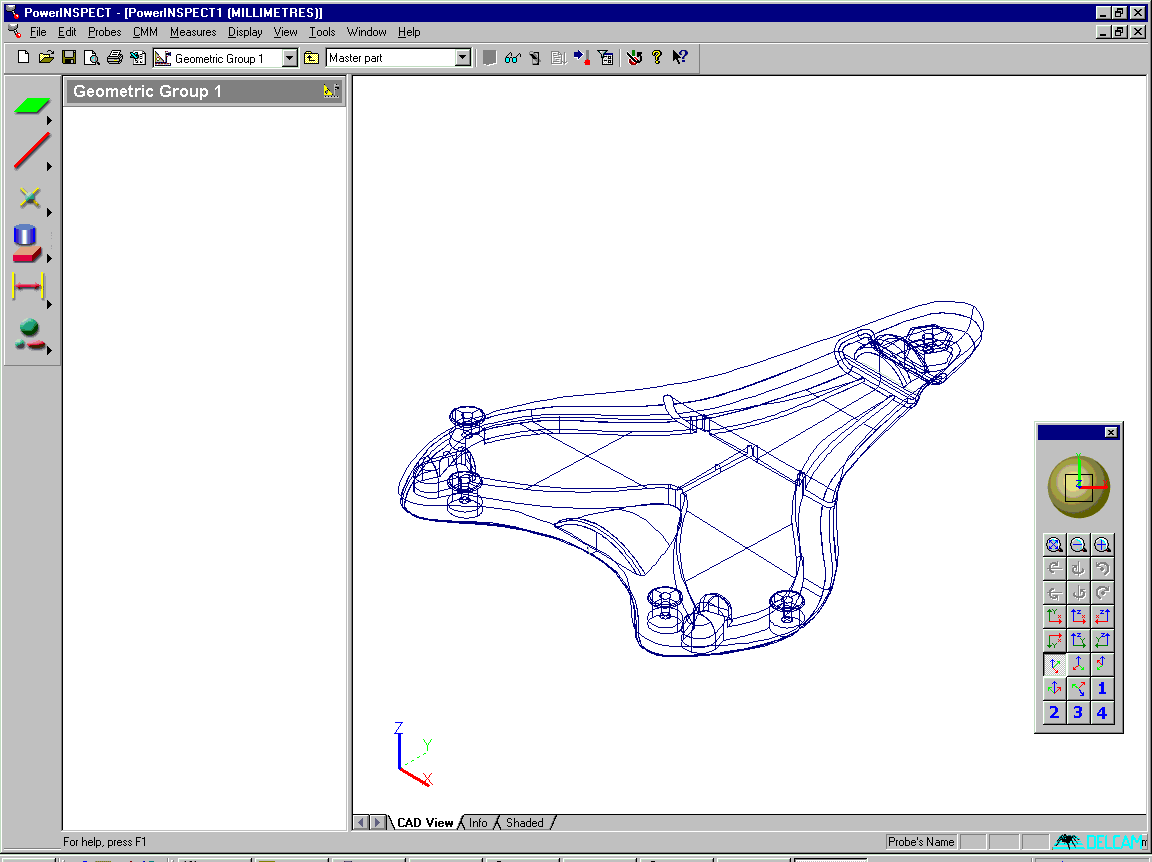
First we must create a probed plane.
![]()
This brings up the probed plane dialog box shown below. We will call the first plane Plane 1. (The names and/or numbers of any Geometric entities can be changed to suit).
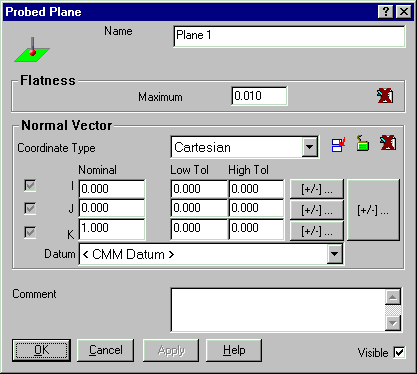
Next you should create two probed circles
![]()
A circle is a 2D measure and therefore each circle is associated with a plane. The first two circles will be associated with plane 1, the only plane created so far.
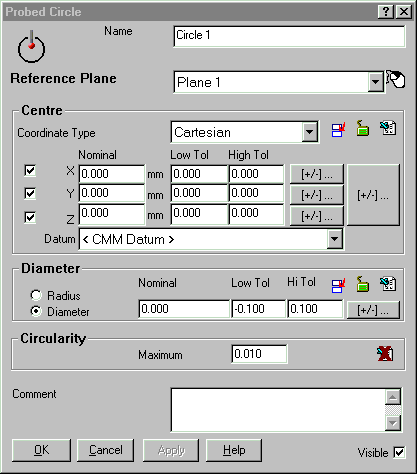
Create a second probed plane.
Create a third circle. The circle now defaults to using the most recently created plane- this is the one we want to use. Circle 3 uses Plane 2 as its reference plane.
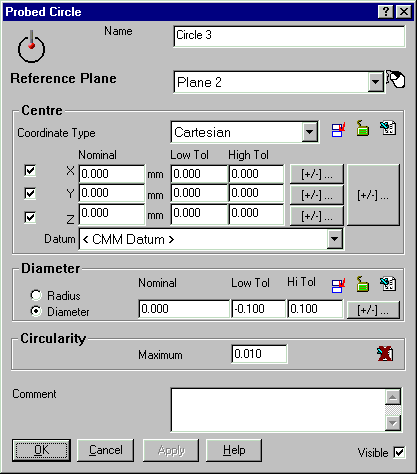
You have now created the following elements in the sequence tree.
We now want to measure the elements we have created.
Note- if you wish to simulate this inspection after the event using the log data, you
can do so by 'right clicking' on the connection flash![]() , and selecting the Simulation option.
, and selecting the Simulation option.
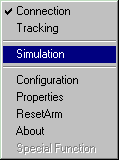
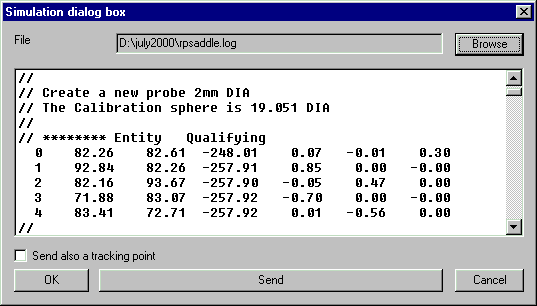
This displays the Simulation dialog box. Use the Browse button to select the log file which contains the list of points. When PowerINSPECT's Probing dialog box is open for an element, you select the point or points you want to use, and press the 'Send' button.
Some types of hardware use 3rd party probes, such as Renishaw, which need calibration.
If we need to calibrate the probe but have not already done so, we must do that first.
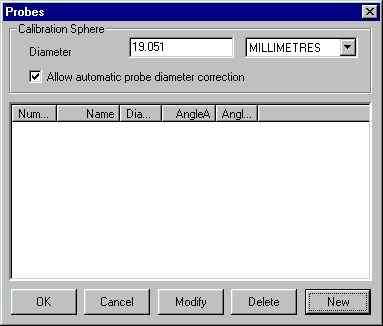
First enter the diameter of the Calibration Sphere used in the session at the top of this dialog box.
No probes are listed in the main body of the dialog box, so we have to create a new
one. ![]()
Enter the details in the Dialog box and select OK.
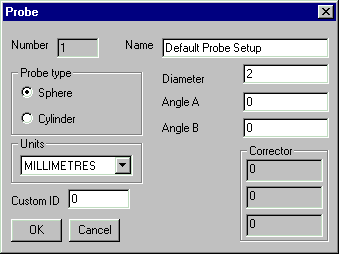
The new probe will be shown in the Probes Dialog box.
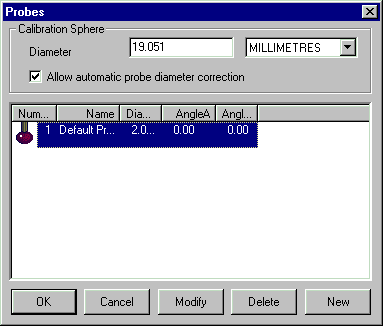
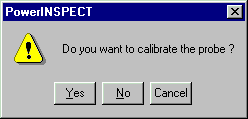
Press 'OK' to use the selected probe. You will be asked whether you want to calibrate the probe. If you have just finished creating the probe ID, as we have, you should probe it. (If you are reusing an existing probe configuration, there is no need to recalibrate it.)
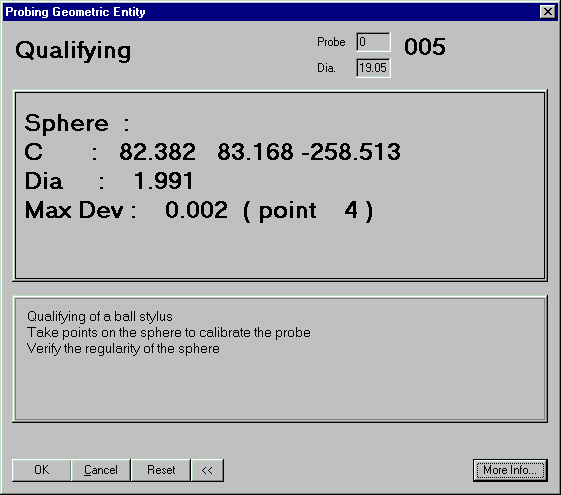
The probe is calibrated using the dialog box below. Note that the number of points taken is recorded at the top right hand corner - 5 in this case.
In common with the other Probing dialog boxes, there is an instruction about how to take the measurement in the lower half of the box.
We are now ready to measure the elements we have created. We do that by selecting Play All, either on the top toolbar as shown,
![]()
or by selecting one of the elements, doing a mouse 'right click' and selecting 'Play All' from the menu.

Each measurement will now be taken in sequence. Follow the instructions in each Probing dialog box. Note that each point taken is recorded by the counter at the top right corner of the dialog box. The measurement results are shown in the central section.
Measuring Plane 1
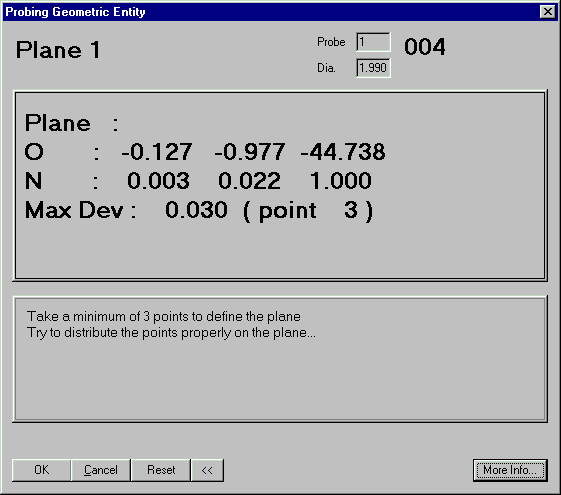
The PLANES & CIRCLES which have been measured are now shown on the CAD Screen. They are not yet aligned with the CAD data. They are shown in relation to the CMM Co-ordinate system which is not yet related to the CAD co-ordinate system.
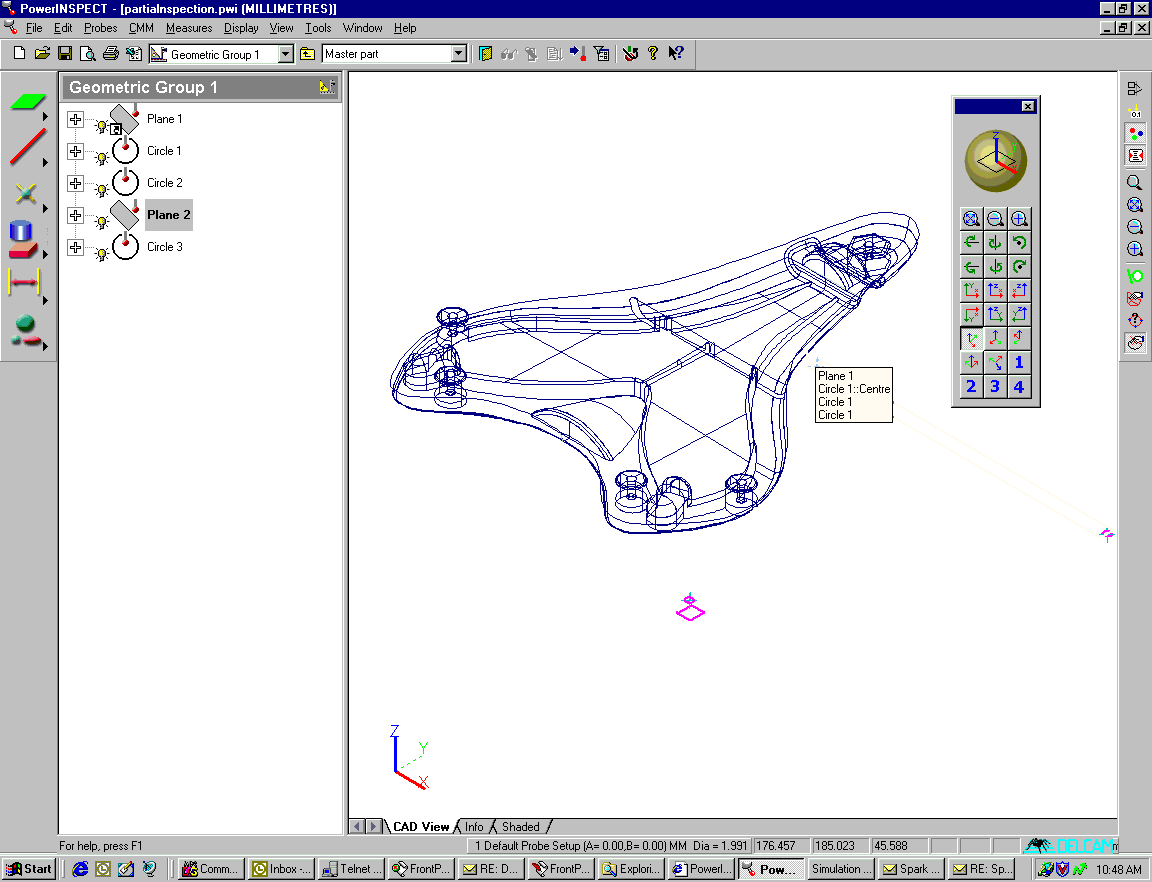
When you have finished measuring all the elements in the group, click on the 'up one level' button in the top toolbar.
![]()
Click on the Alignments Icon. This will show the variety of Alignments available. The Best-Fit is the one to use in this example (as shown below).
![]()
The Wire-Frame Checker, ![]() , can be used to determine the
co-ordinates of the entities required. If you already know the co-ordinates from the CAD,
drawing , or a set-up sheet you can use these directly.
, can be used to determine the
co-ordinates of the entities required. If you already know the co-ordinates from the CAD,
drawing , or a set-up sheet you can use these directly.
The
C2 = 46.543 , 57.14 , 74.60
C3 = 149.103 , 250.384 , 73.03
C4 = 213.420 , 17.246 , 77.552
C5 = 84.788 , 17.246 , 77.552
:- PLANE 1 , CIR 1 , CIR 2 PLANE 2 , CIR 3 PLANE 3 , CIR 4 , CIR 5 It
is also possible to flag Point 1, as a
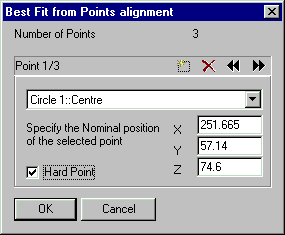
After entering the XYZ coordinates for the 3 Circles, left mouse click on the OK
button. The position of the Circles and Planes should move to the correct position on the
CAD screen.
If an error has occurred during the entering of the data then the Geometric entities will
not be in the correct position and the positioning can now be modified to suit (with the
original PLP the entities could not be viewed on the screen and errors were not easily
recognisable). This amendment or re-positioning can be performed until the user is
satisfied that the positioning is correct.
The following view is a
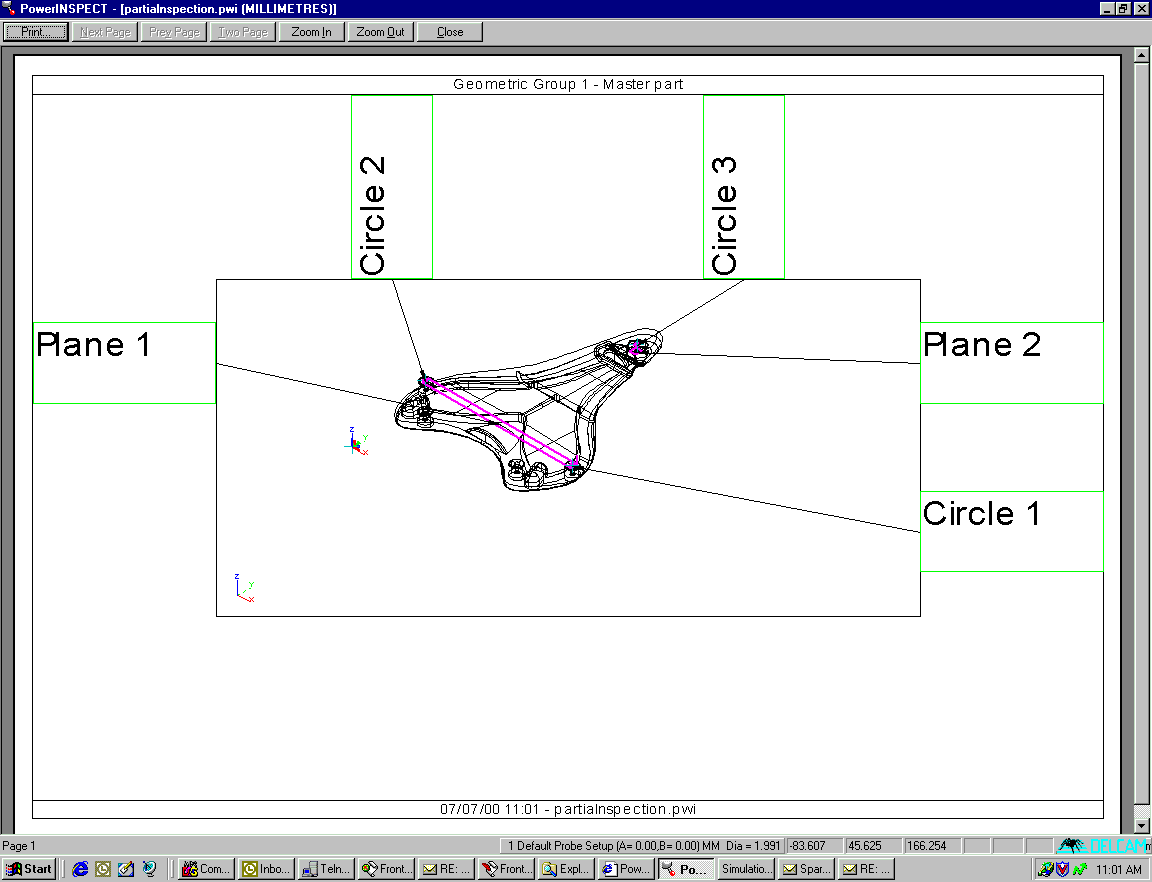
For further details about the Best Fit (Points) alignment method, see the technical note, PWI000053.
Once the alignment is seen to be correct an
Click on the ![]() .
.
Fill in the form

The screen now changes to the
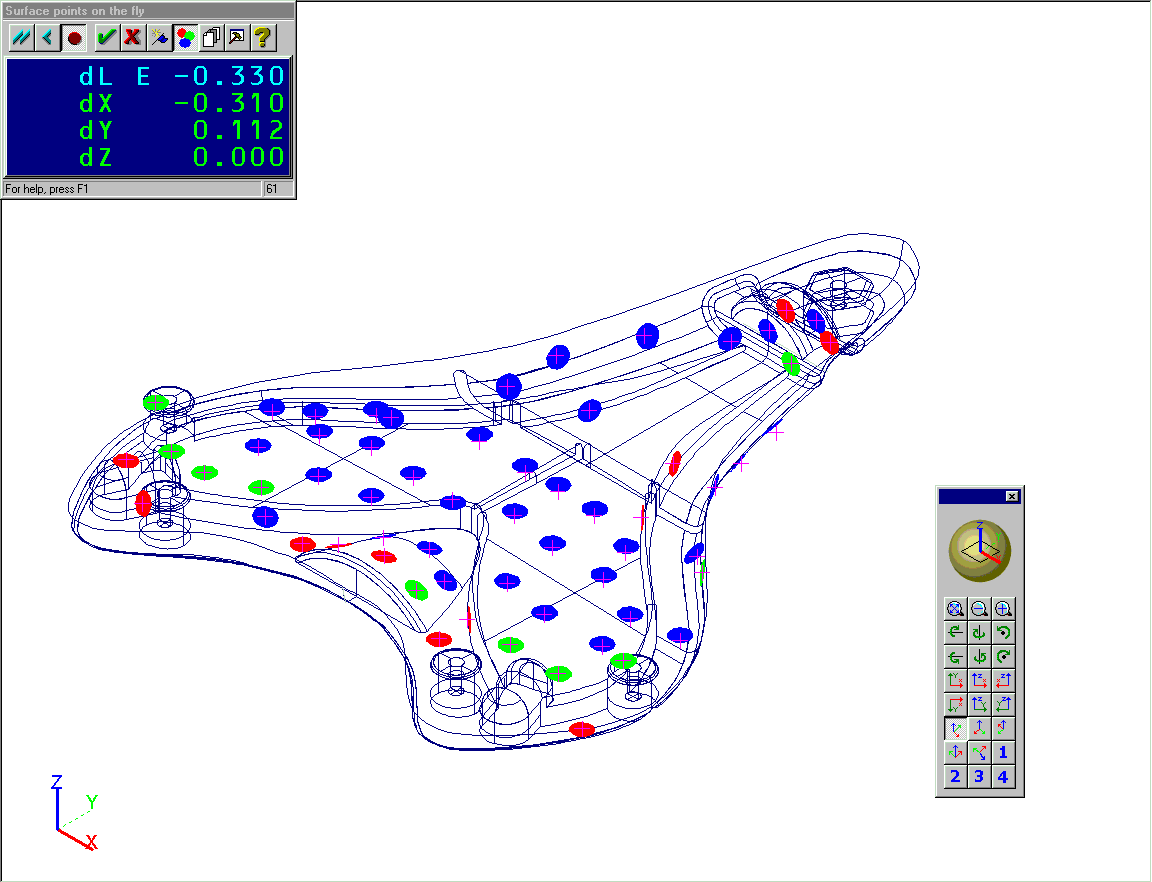
Once the Inspection Group is complete it can be shown with the confetti or with labels
etc.
The next view shows the simple labeling format
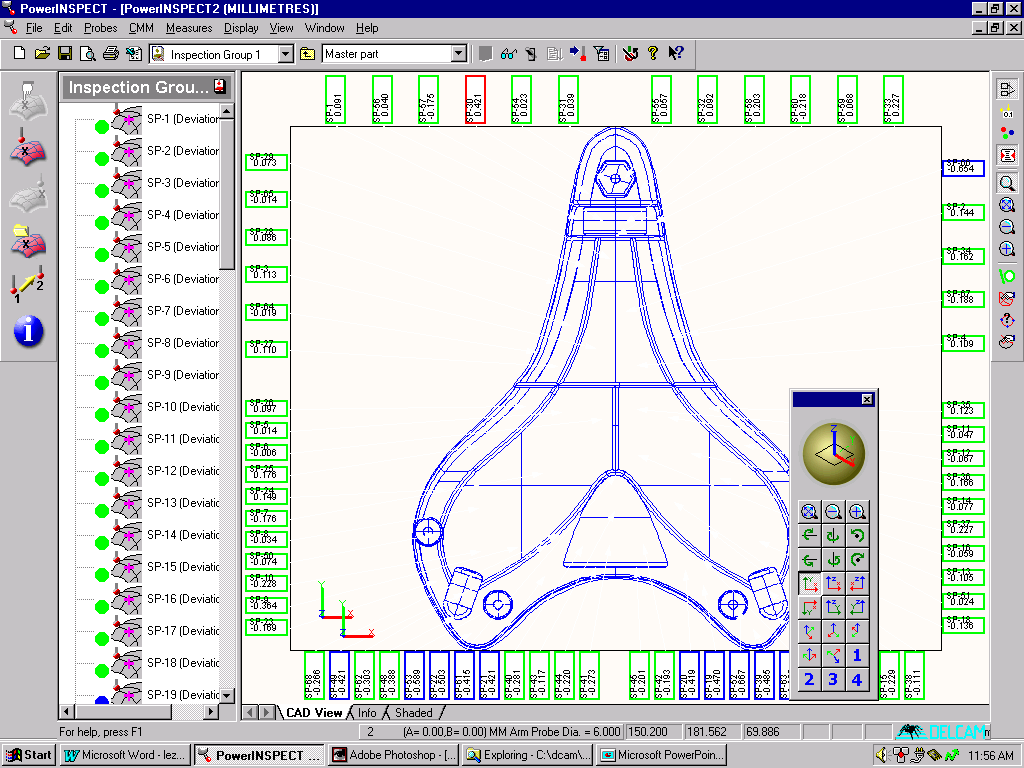
Anything that appears on the CAD Screen can be Print-Previewed and then printed off and included in the final Inspection report as a visual aid.
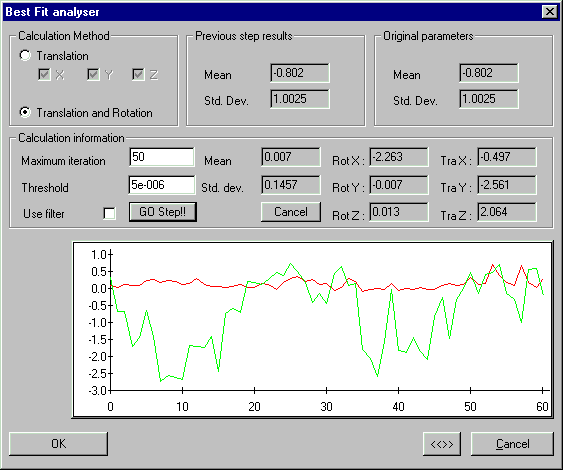
If the points taken are not within an acceptable tolerance a Best-Fit can be performed on the points taken to refine the group. The Best-Fit analysis can either be used by Translation or Translation & Rotation.

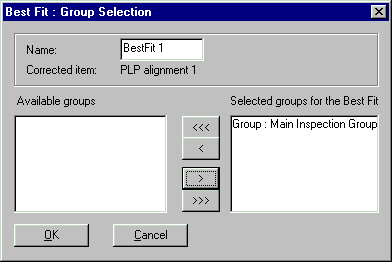
A best-fit may be used on some or all of the inspection groups. As before, select the group(s) required for the best fit, and move them to the 'Selected' column on the right.
Once the Inspection Group is entered into the analyser, click on “Go Step” ![]() and the analysis takes place. The before and after appears on the
small screen; the rotation, translation and deviation can then be viewed by the user. This
will normally reduce the range of the deviations, as the points are fitted better to the
CAD.
and the analysis takes place. The before and after appears on the
small screen; the rotation, translation and deviation can then be viewed by the user. This
will normally reduce the range of the deviations, as the points are fitted better to the
CAD.
The Inspection Group can then be viewed again (Open Group) and the points can be seen to have changed to suit the analysis (if this analysis is deemed unsuccessful then another Inspection Group can be taken and the same steps followed to create another best-fit). This operation can be performed again and again.
Once the Positioning (to include best-fit) is acceptable, Geometric elements can be measured and added to the Inspection Report.
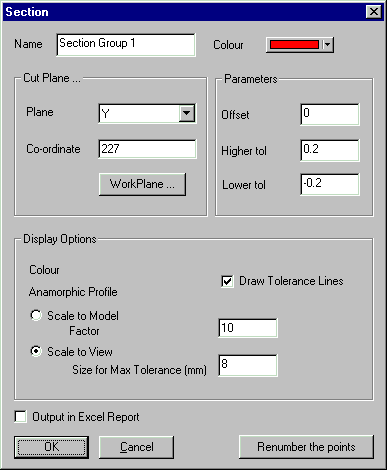
This section has been created at Y=227.
A line is shown across the part at the correct position, in the colour chosen in the 'Section' dialog box. You should take points along this line. They will be shown as confetti, using the usual surface inspection colour conventions.
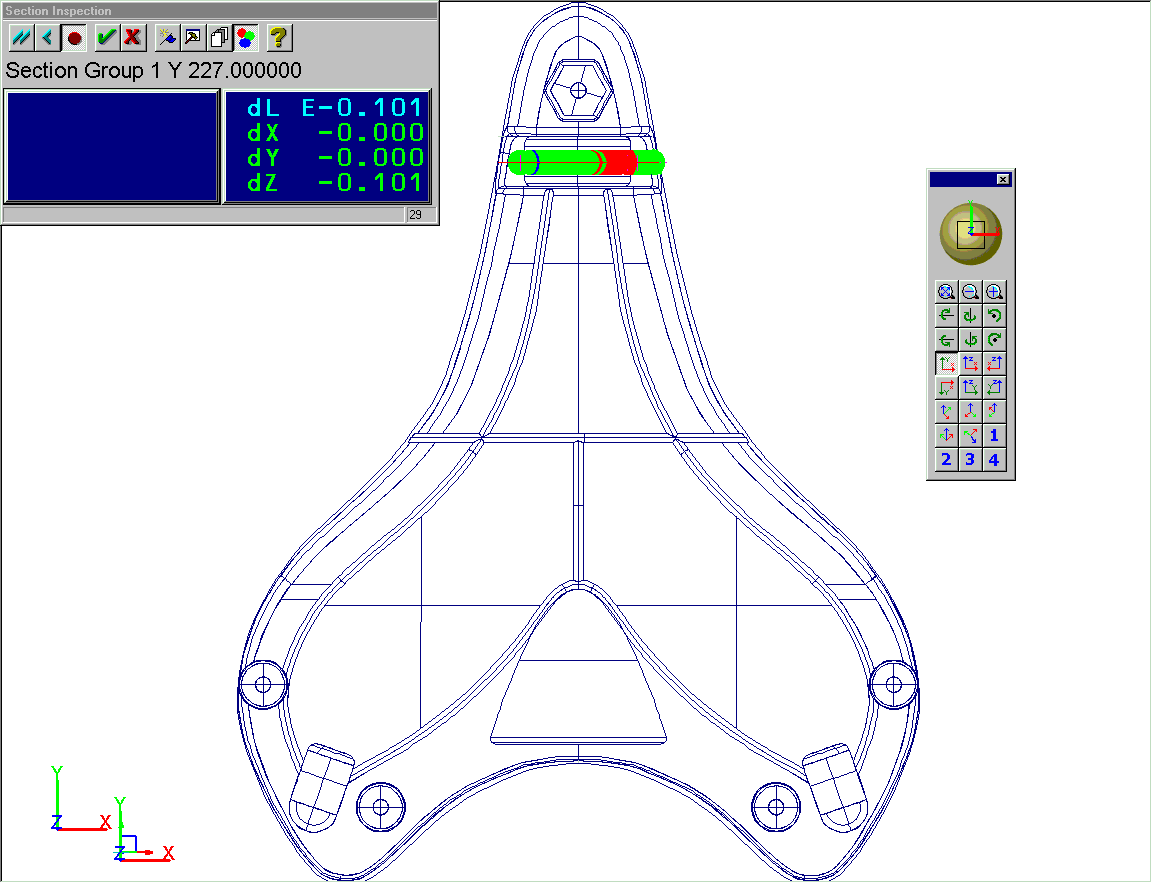
When you have finished measuring the section, click on the 'green tick' ![]() to stop measuring.
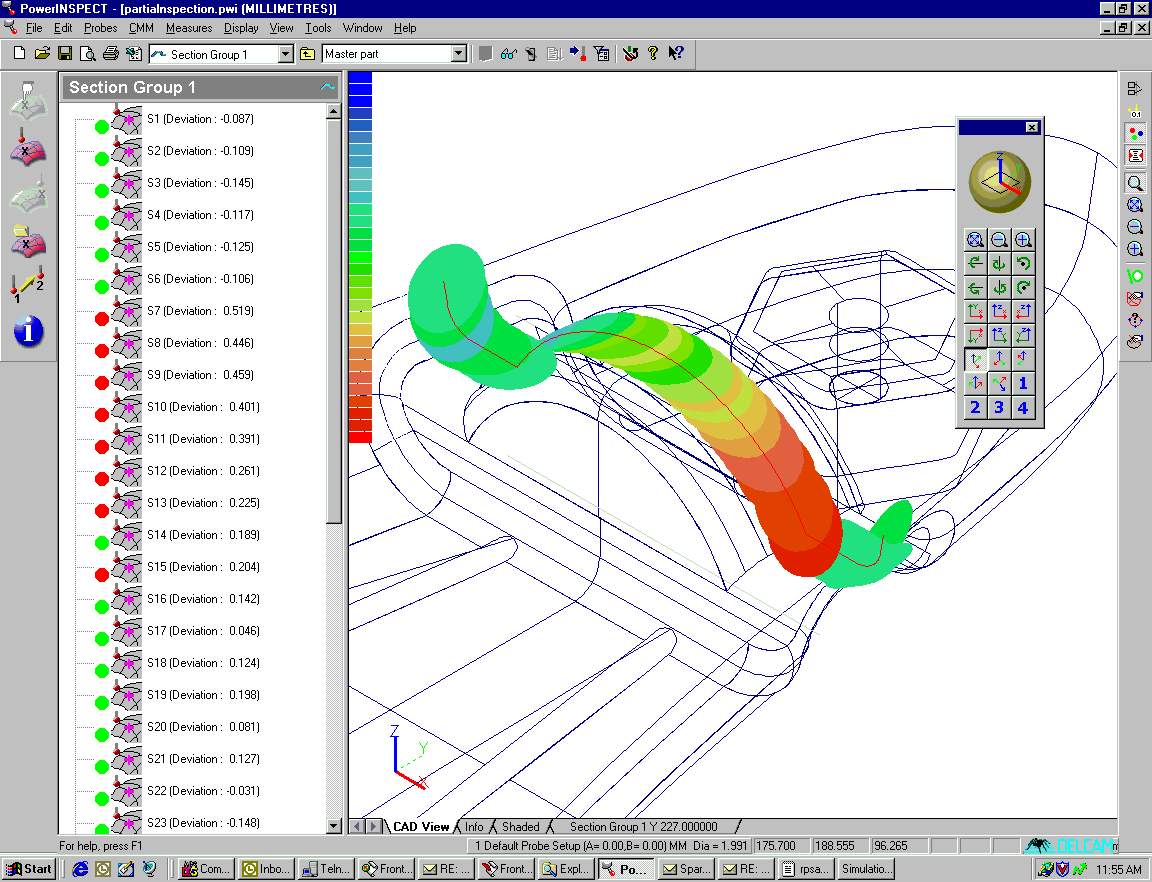
The screen will revert to the normal CAD and sequence tree view, showing the inspection
confetti along the section line.
to stop measuring.
The screen will revert to the normal CAD and sequence tree view, showing the inspection
confetti along the section line.
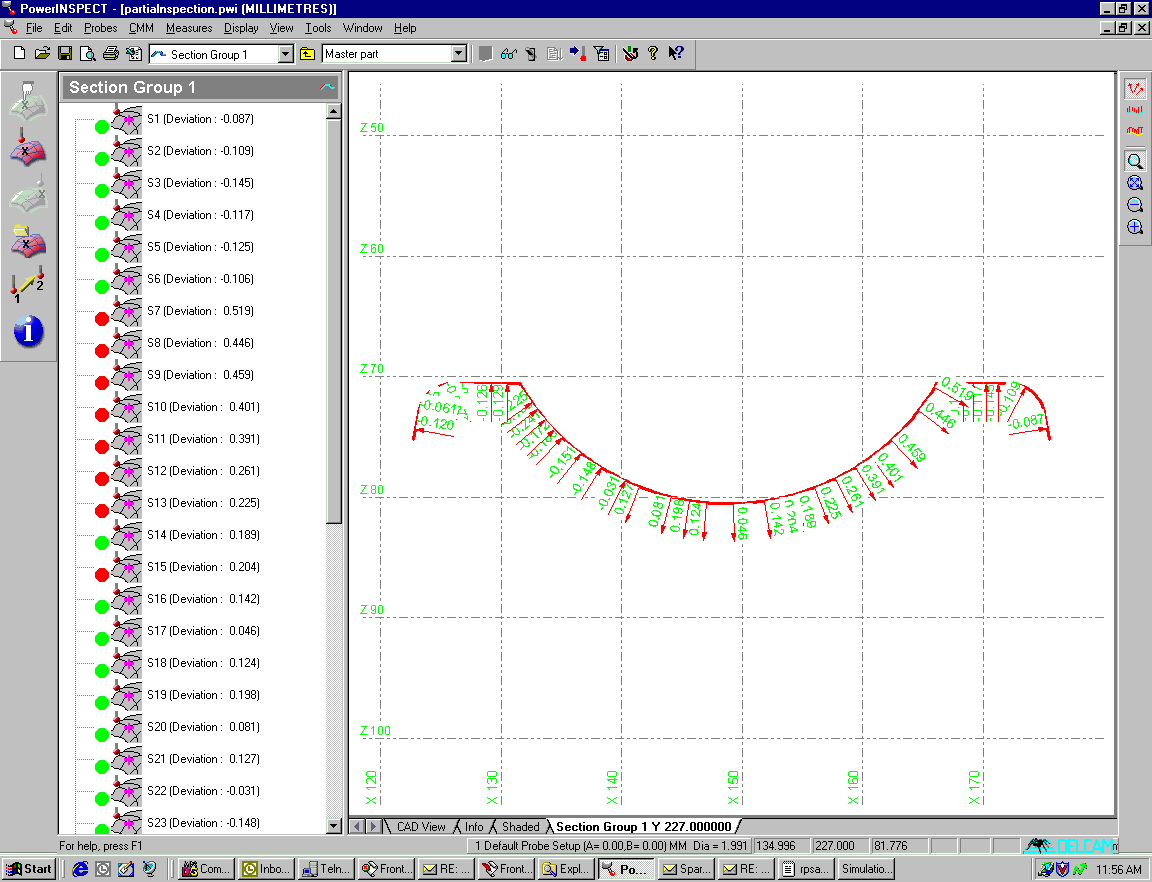
A new tab will also appear at the bottom of the screen as a result of this measurement- the 'Section Group' tab. If you click on this tab you will see the section view.
The final portion of the demonstration relates itself to the Point Cloud facility and is called the Curve Digitiser. This allows PowerINSPECT to Digitise points, sections & multiple sections with or without the CAD data being available. This section can be treated independently from the rest of this document.
A full and detailed description of Digitised Curves is in ‘What’s New in
PowerINSPECT 1.300’ and in the technical note, PWI000054.
The
To start the
![]()
Once into the Point Cloud Group there are 2 options Curve & Point Cloud from a File. In this section only Curve is dealt with.

Once Curve Digitiser Tool is open click onto the Curve Sketching Options icon
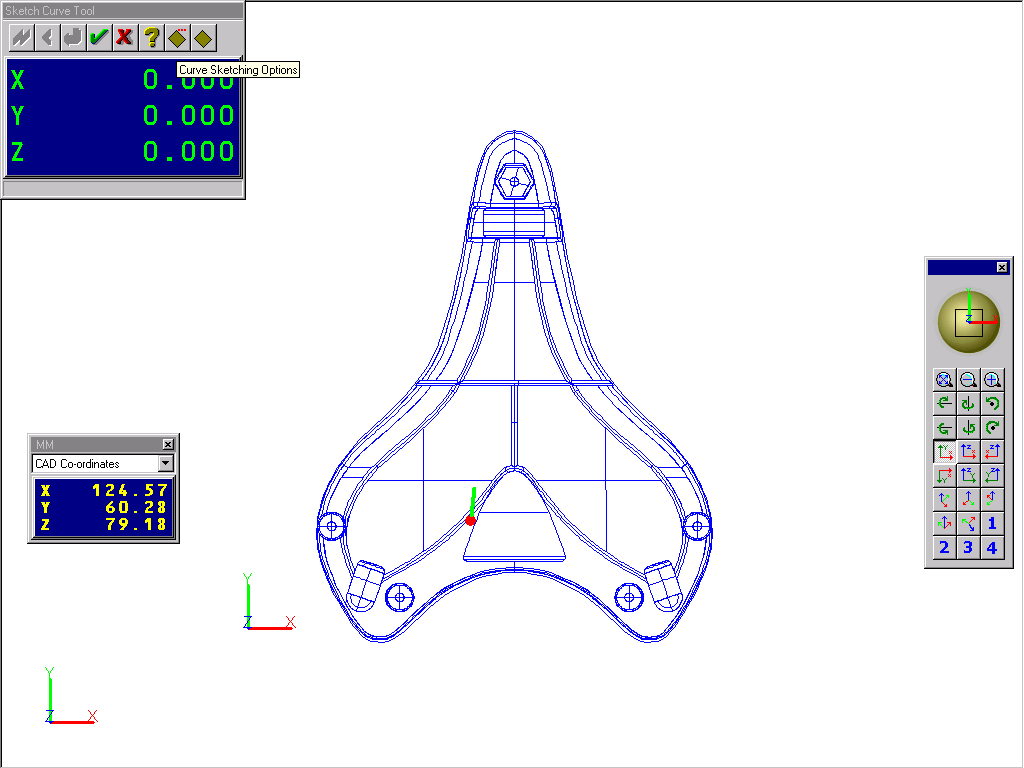
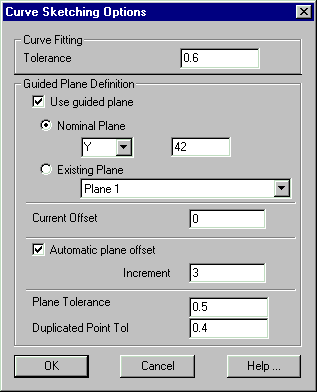
Using the Guided Plane Definition (left mouse click) a Plane can be set-up to denote where the first digitised section will take place. The Nominal Plane can then be entered (below shows the Nominal Plane as Y 60.) Entering an Automatic Plane Offset with an increment (10) will automatically create the next Plane where the digitising can take place. This function allows the user to set the Plane & Increment at the beginning of Digitising and take as many sections as required and also to add extra sections if necessary.
If using a CMM then it is preferable to have the component set-up as true to the Major Axes of the CMM as possible. This makes the taking of points easier because you can move in one axis only.
If using an Articulated Arm you can take points by keeping the button depressed and scribing over the section required (i.e. zigzagging): a point will be received each time the probe passes over the set Plane. In this instance the Component need not be true to any axis.
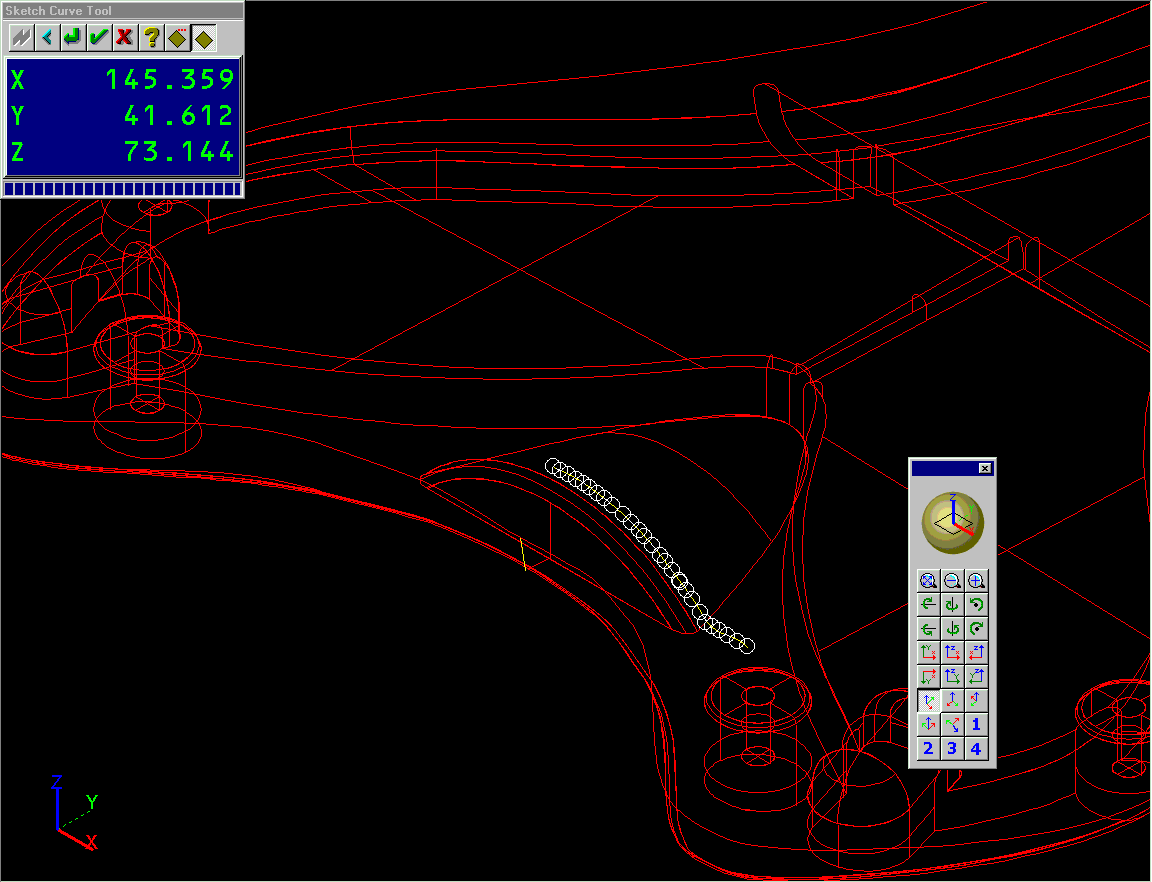
Points are then taken on the surface where the first section is required (remember no CAD data is required because the digitising can be carried out with or without CAD) and the points appear as small circles when they are taken as below.
The following view shows points taken at a section Y42 and then Y45. Increment to the
next plane by (left mouse clicking) onto Start New Curve ![]() thus incrementing by
the specified distance. Take points again at the new position. If required, more sections
can be digitised remembering each time to (left mouse click) onto Start New Curve.
The Increment will remain as defined (10 in this example) and the following curves will be
added next to the original.
thus incrementing by
the specified distance. Take points again at the new position. If required, more sections
can be digitised remembering each time to (left mouse click) onto Start New Curve.
The Increment will remain as defined (10 in this example) and the following curves will be
added next to the original.
This process can be repeated for X and/or Z by amending the Nominal Plane to X or Z (stating the Plane and increment required). It is important to remember that if a New Curve Sketch is required for X and/or Z that the Use Guided Plane Definition must be ticked.
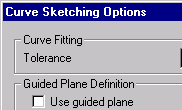
Any Existing Plane can be used in conjunction with a Current Offset if required.

Once enough sections have been digitised then (left mouse click) onto the Green
Tick ![]()
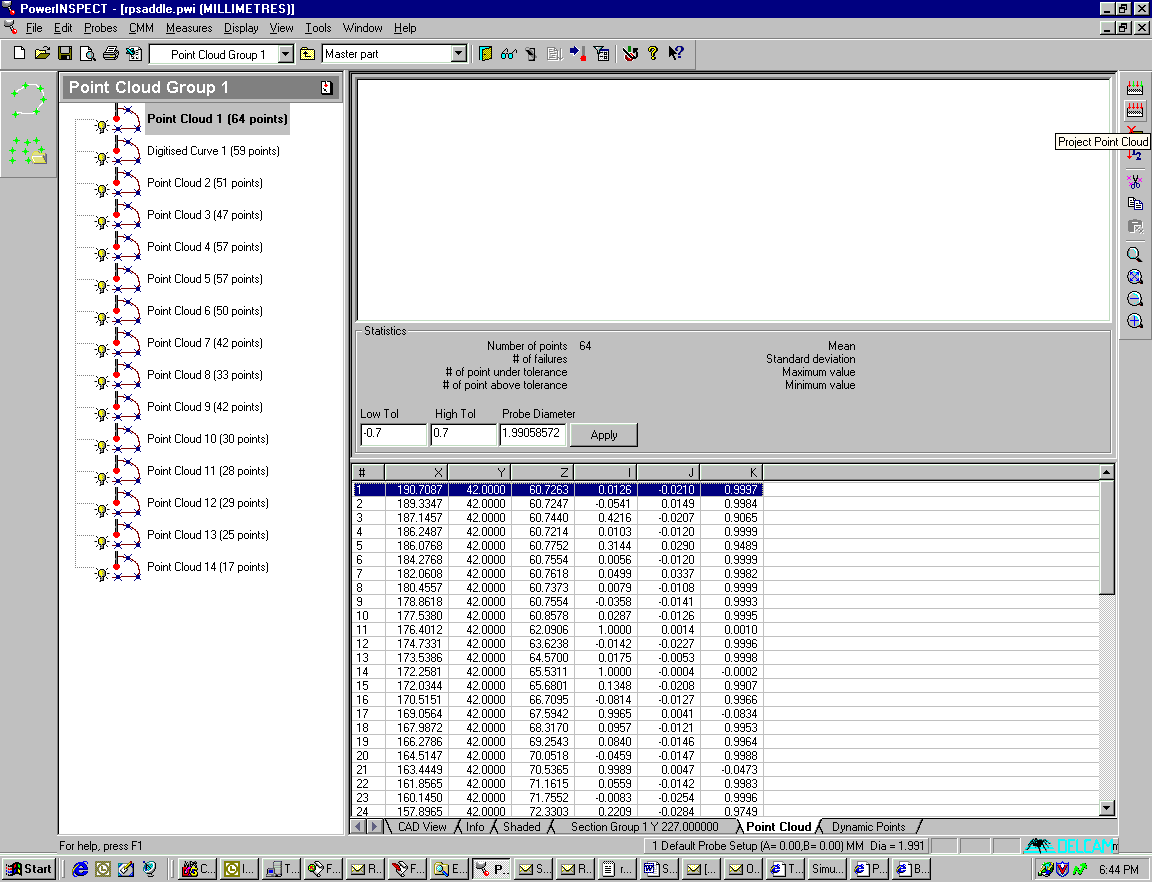
Point Clouds show the probe centre, but you can project a point cloud onto the CAD surface. Click on the Point Cloud tab at the bottom of the screen to see details of the point cloud.
The details in the point cloud screen refer to the cloud or curve selected in the sequence tree on the left. The screen shot below shows an unprojected point cloud. To project a point cloud, click on the 'Project Point Cloud' button on the right hand toolbar as shown below.
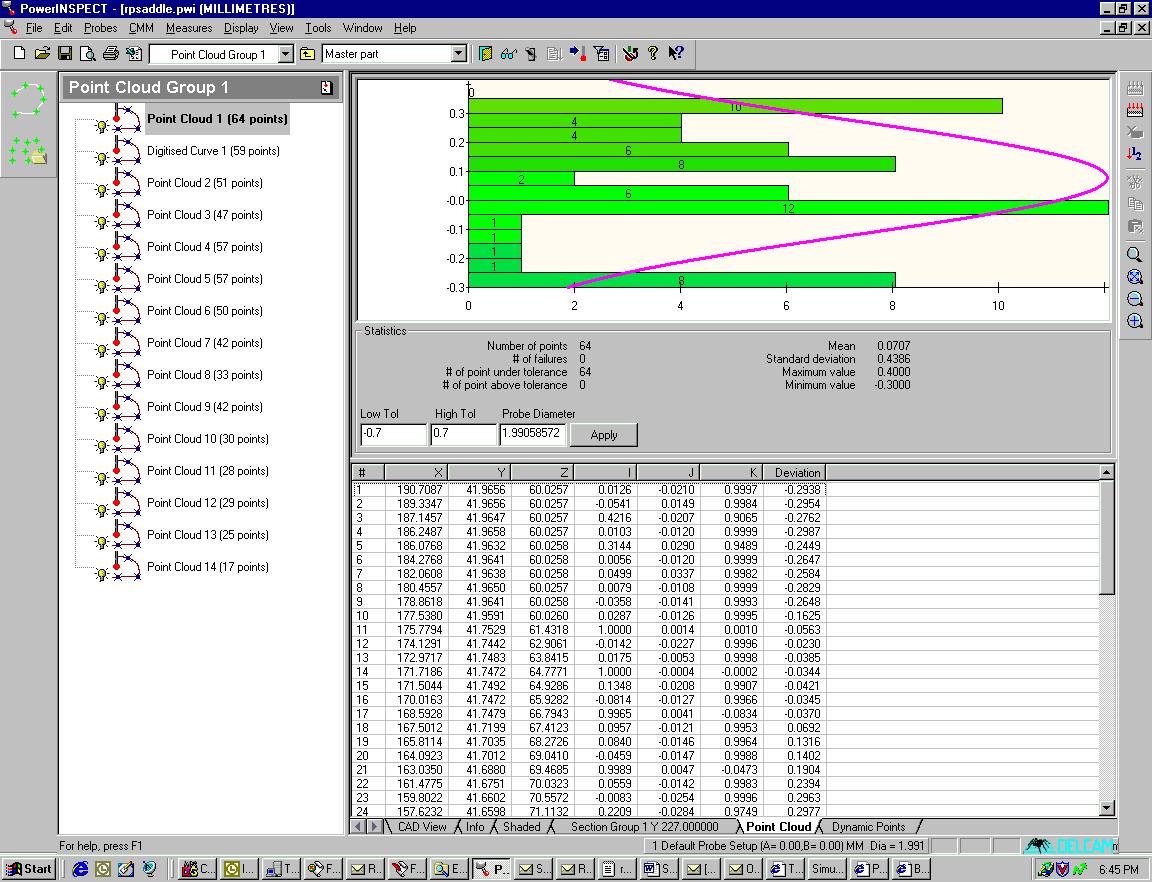
As the point cloud is being projected, the statistics section and the upper and lower windows will be periodically updated. The results are shown as a distribution. You can use the 'zoom' menu section in the right hand toolbar to see a larger or smaller section of the Gaussian curve produced.
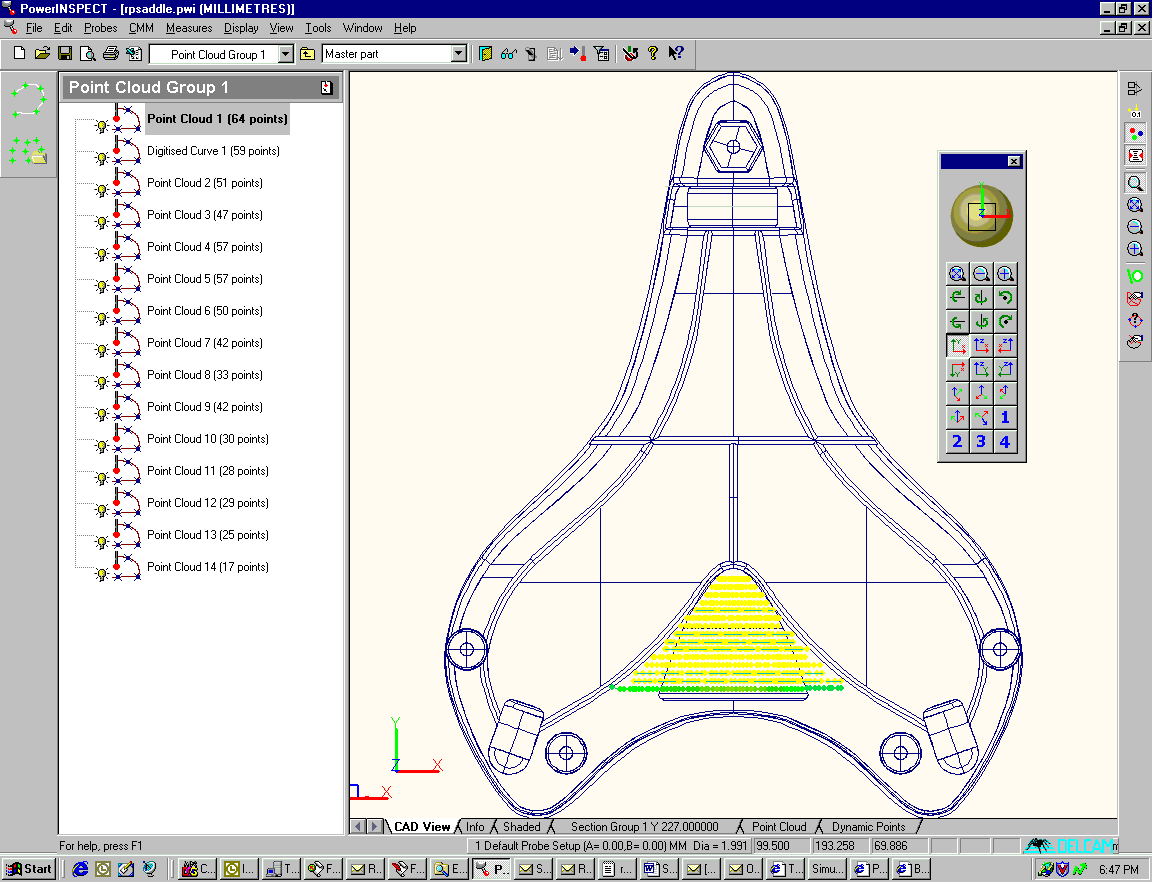
When you have projected a particular curve, the points will be shown in colour according to the usual PowerINSPECT conventions, carrying over the colours used in the distribution curve shown in the point cloud tab.
You can use the 'zoom' menu section in the right hand toolbar to see a larger or smaller area of the Gaussian curve produced.
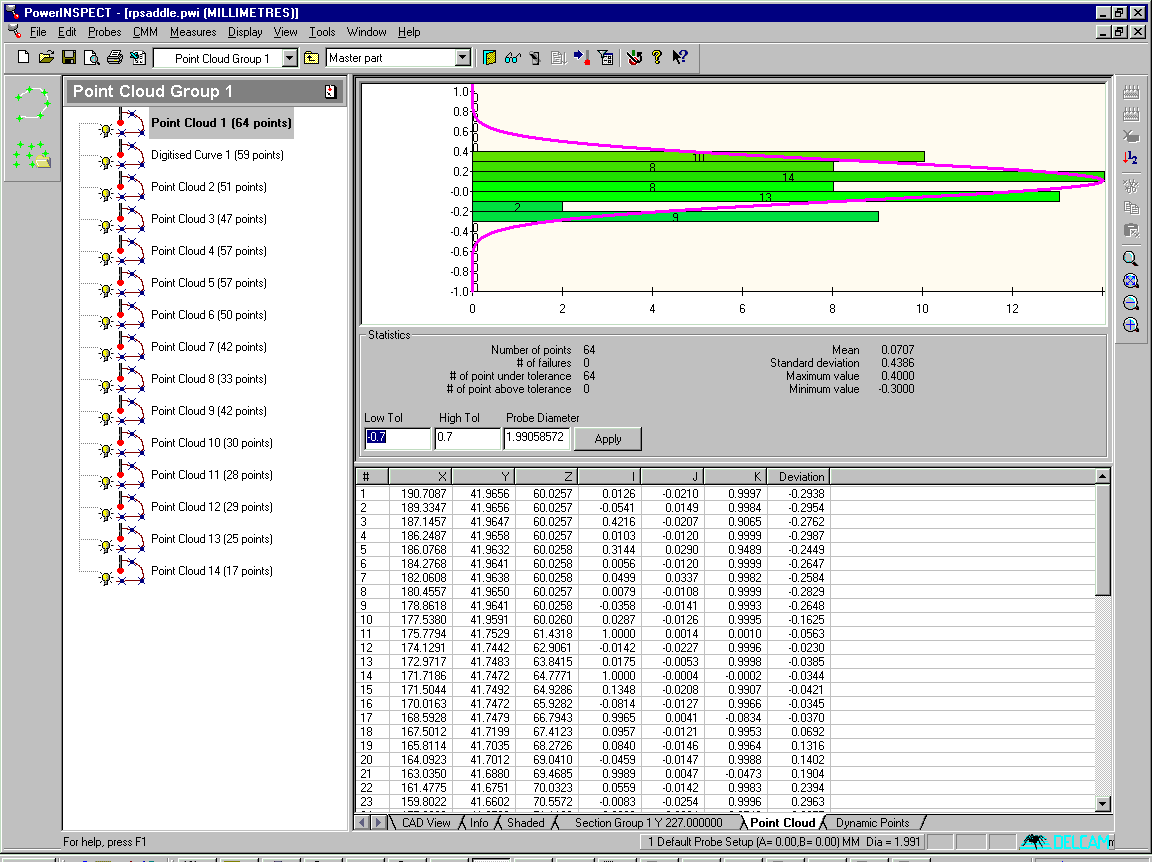
The 'print' or 'print preview' section of the report shows the selected view and relevant data from the Point Cloud tab, together with the selected view from the main CAD window view.
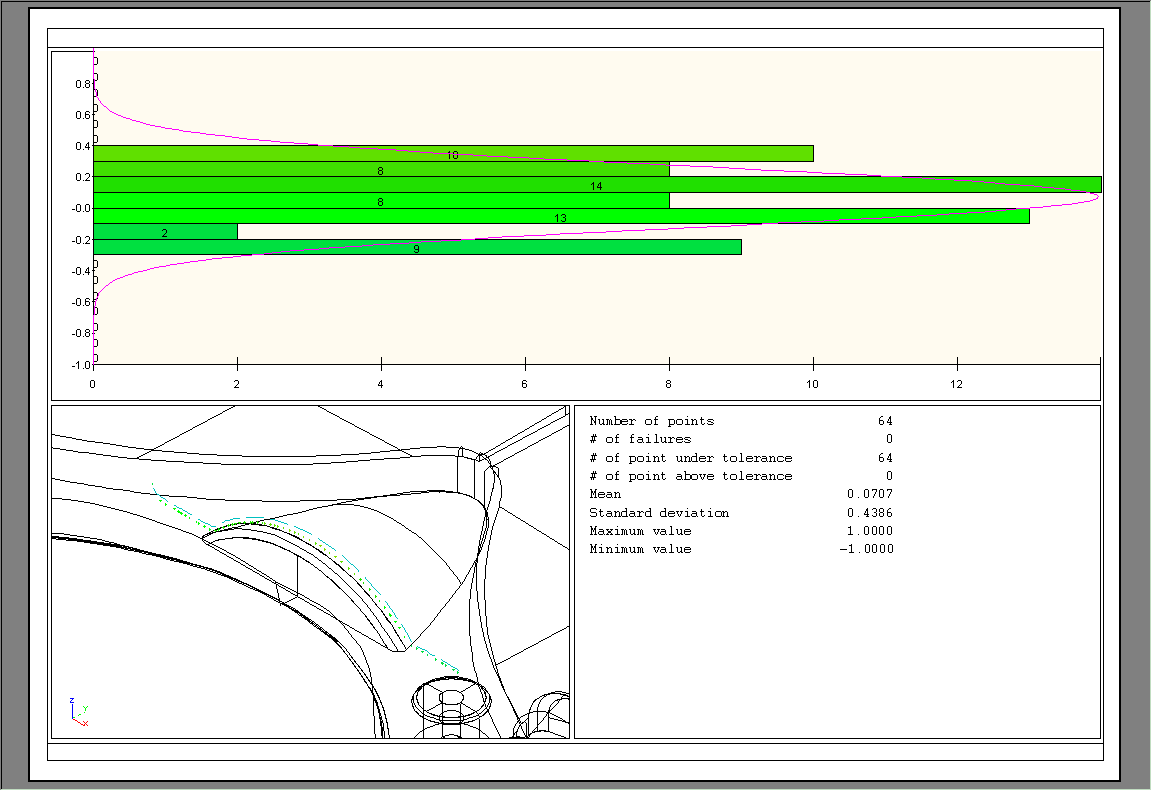
You can view projected points in the main CAD as you would view surface inspection confetti.
